

Power BI Management Reports
Get full visibility over your Power BI environment.
Track usage, performance, costs, and opportunities in one easy-to-use dashboard—purpose-built for Microsoft 365 and Power BI Admin.
“Flock’s Power BI dashboard helped us uncover underused licenses and optimise performance across our reports. It paid for itself in the first month.”
— Happy client.
Turn Power BI Complexity Into Clarity
Is your Power BI environment growing faster than you can govern it?
Are reports, workspaces, and users multiplying without a clear view of what’s being used, or by whom?
Our Power BI Management Report gives you immediate visibility across your environment so you can govern with confidence, reduce risks, and make better decisions.

What’s Included
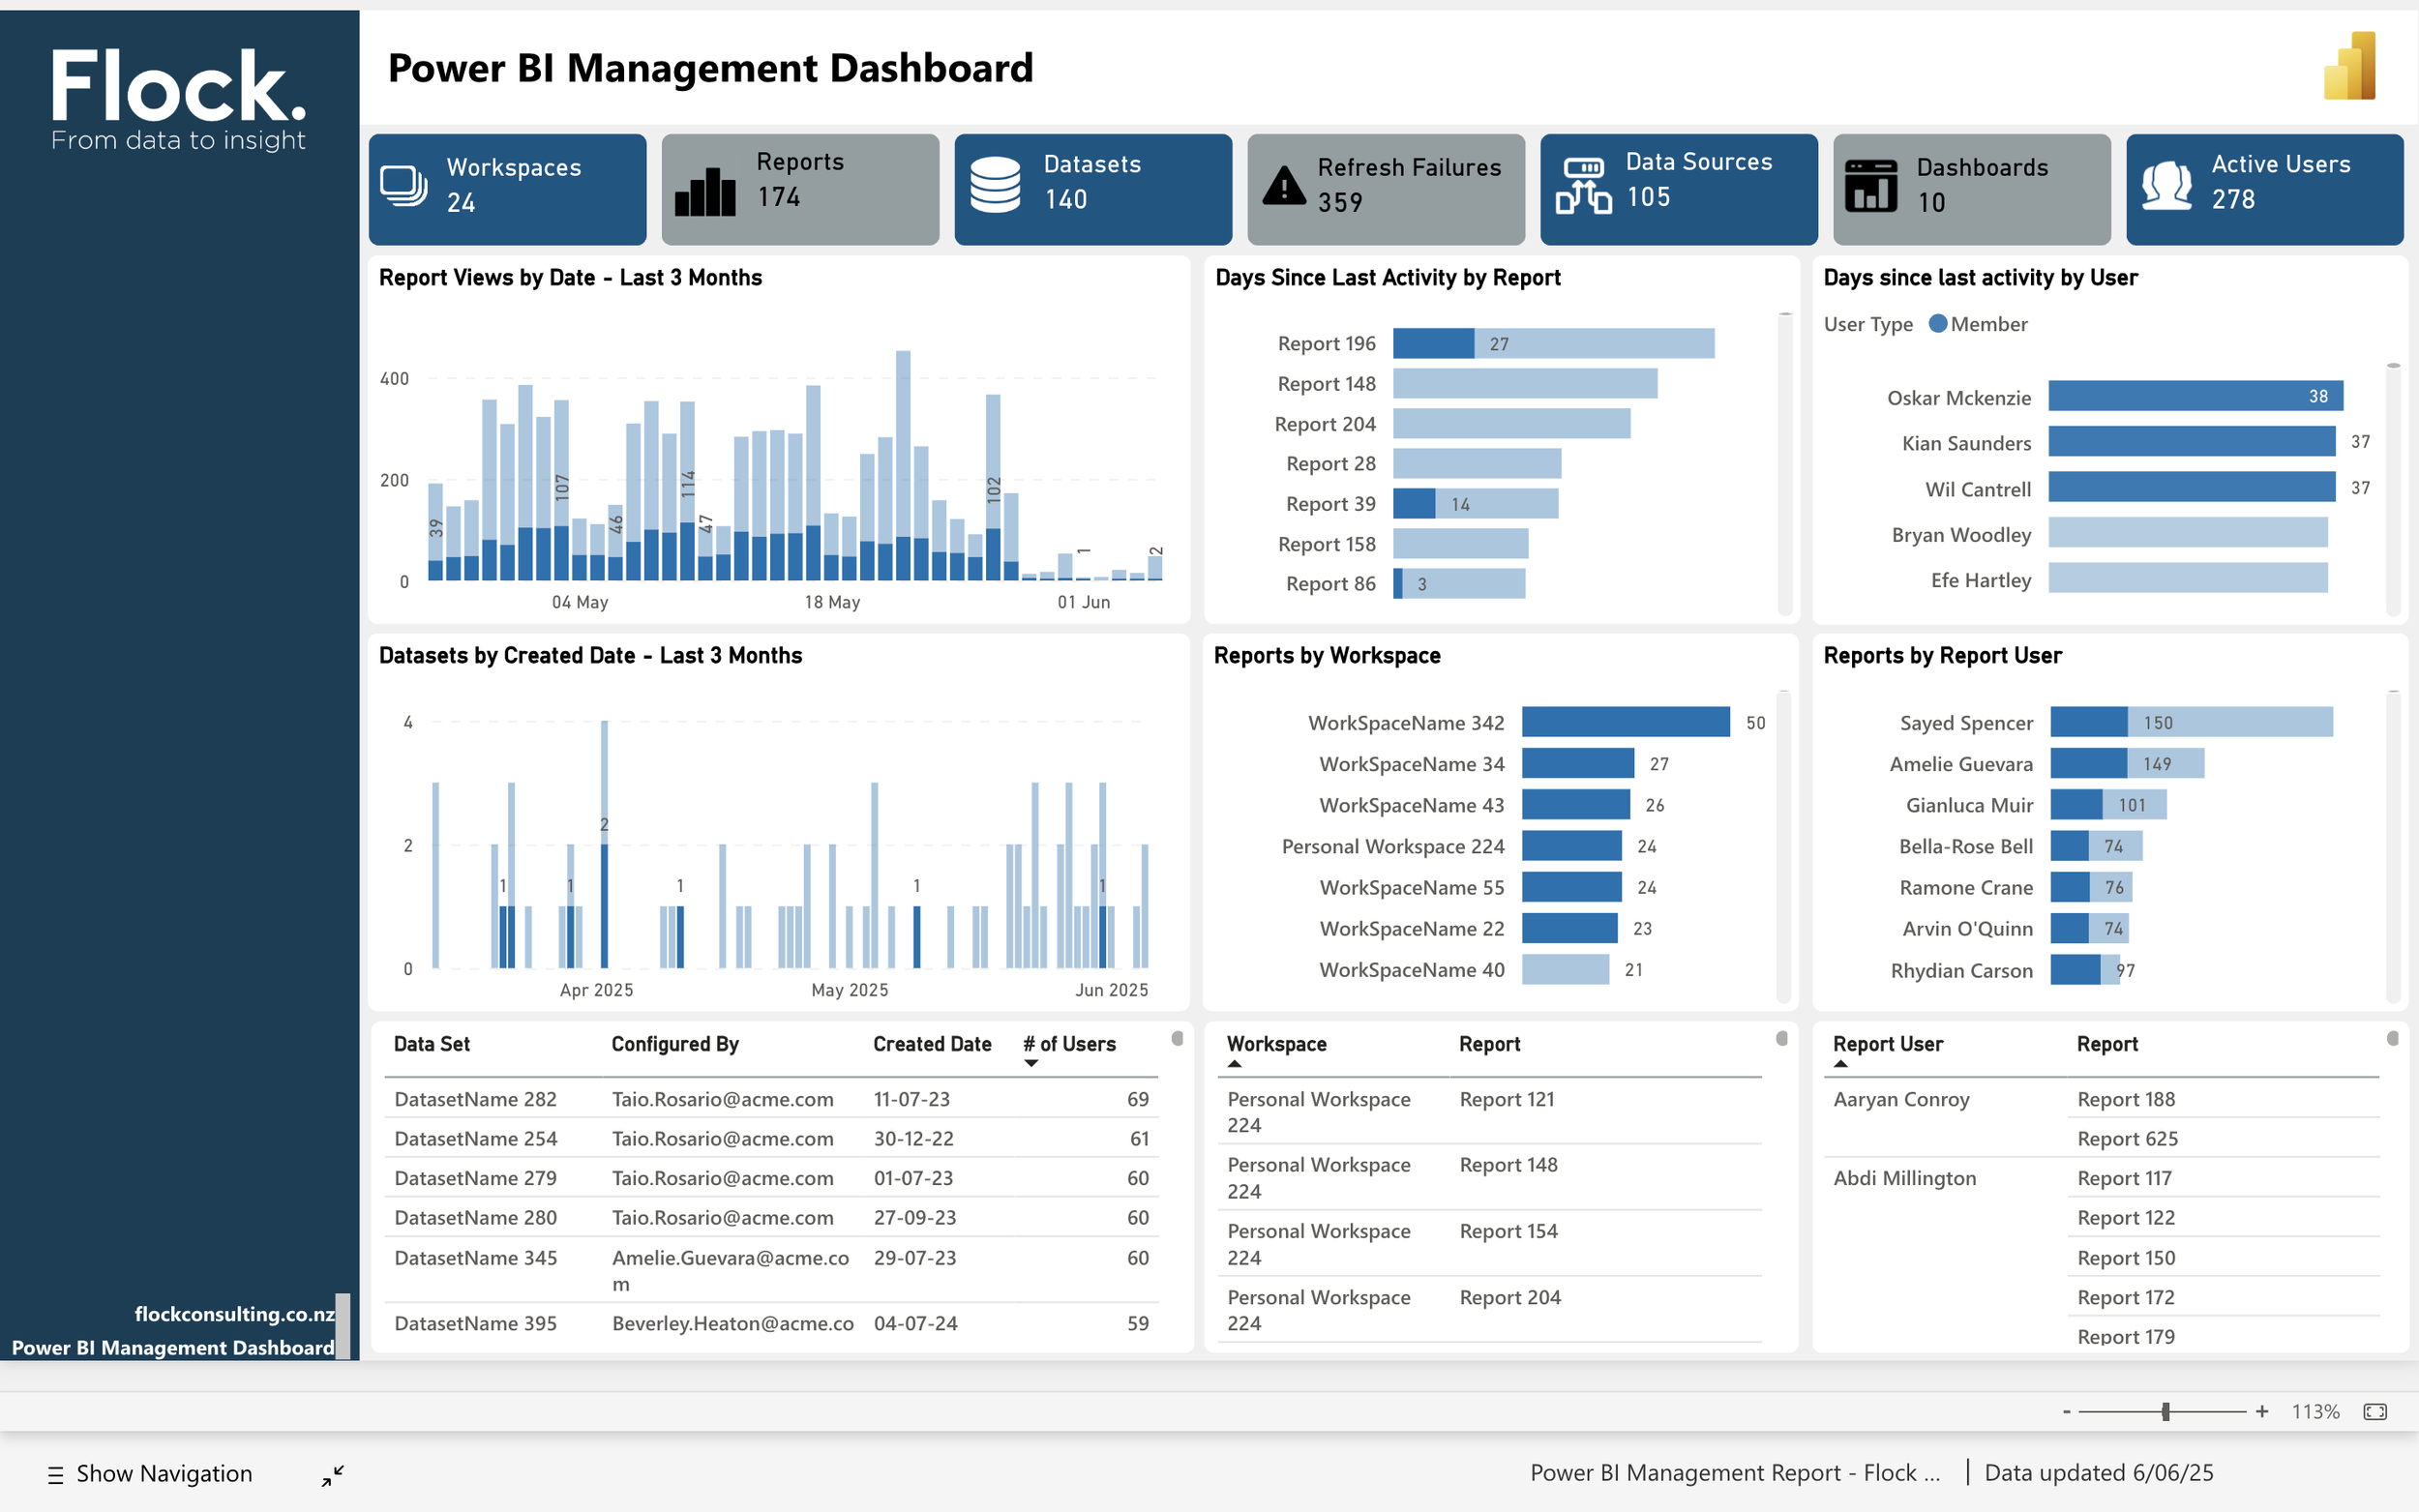
Our out-of-the-box Power BI Management Report provides centralised insight across four key areas:
-

Workspace Summary
Gain visibility over all your workspaces — including owners, creation dates, and activity — to identify what’s current, redundant, or needs attention.
-

Report Use
Track report views and active usage to identify underutilised or high-value reports, helping guide your clean-up or training efforts.
-

Data Quality Checks
Surface reports or datasets with broken connections, refresh failures, or other critical issues that impact trust and usability.
-

Permissions Overview
Get a clear view of user access by workspace, so you can manage permissions consistently and improve security.
Why It Matters
Organisations rely on Power BI to inform decisions, but as your environment scales, so do risks and inefficiencies.
Our Management Report helps you:
✔ Discover orphaned or unused reports
✔ Improve adoption and reduce licensing costs
✔ Standardise permissions and workspace structures
✔ Build trust through better data quality and visibility
-

Flexible Deployment
We deploy the report directly into your Power BI tenant using the Microsoft Admin APIs — no additional infrastructure required.
-
Auto-Refresh
It’s refreshed automatically, ensuring data accuracy, efficiency & timeliness.
-

Custom To Your Needs
Our Power BI Management Report can be tailored to your governance and reporting needs.
Optional Add-ons
-
Declutter your Power BI environment for clarity and control.
Over time, Power BI workspaces can become cluttered with unused reports, outdated datasets, or abandoned projects—making governance and usage tracking difficult.Our team will help you audit your existing workspaces, identify what’s no longer needed, and safely archive or deprecate reports and datasets in line with best practices.
The result: a cleaner, faster, and more manageable reporting ecosystem.
-
Set a consistent structure that scales with your business.
We help you establish naming conventions and workspace templates tailored to your business units, report types, or audience segments.This makes it easier for your teams to navigate Power BI, find relevant content, and maintain a standard approach to report delivery—especially useful for onboarding new team members or scaling analytics initiatives.
-
Codify your approach to Power BI management and governance.
Governance isn’t just about rules—it’s about clarity, accountability, and flexibility. We develop custom governance playbooks and policy guides to formalise roles, responsibilities, usage policies, security settings, and data handling procedures.These living documents support a culture of trust and transparency around data access, usage, and ownership.
-
Build internal capability with practical, role-based training.
Whether your team is just starting out or managing complex enterprise-wide deployments, we deliver tailored training sessions for Power BI admins, workspace owners, and data stewards.Our sessions cover governance fundamentals, workspace best practices, monitoring tools, lifecycle management, and more—equipping your team to maintain control while enabling business users.
Ready to Take Control?
Let us show you how it works and how much time and effort it can save.
Frequently Asked Questions
-
We deploy it securely using Microsoft’s APIs with read-only access and configure it for your tenant.
We send you a link that can be actioned by your Power BI administrator. That link creates a download to deploy the App and create a new workspace and report.
-
To get the data feeding into your report we need access to your Power BI Metadata REST API’s. To access these we get your Azure Administrator to Set up a security group, then grant our Service Principal access.
We then set up the data extraction and provide you with credentials.
Once you have downloaded the report you are able to enter your credentials into the App to start the flow of your data
-
Data is reloaded every night at 9:00pm in the timezone you reside.
The App is then set to reload at midnight in your Power BI service
-
100%. You retain full control and all access is read-only with no third-party hosting required.
-
We will release an updated version of the report every quarter.
Each update will include improvements that we have identified as well as ideas that come from our customers so please suggest your ideas.
-
There are no long term commitments, you can cancel at any time.
-
No, the dashboard works with Pro licenses and standard workspaces.
-
Yes, Pro and Premium tiers allow full customization to your team’s needs.